Data Bars and DataGridView
A lot of people out there will by now have seen the screenshots of Excel 12 (now Excel 2007) and its excellent "data bars". For those that haven't, click here to read about them.
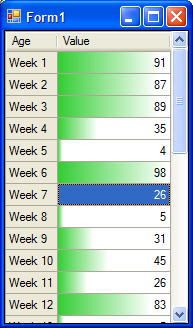
Now, we're working on a little application here that has a form where the user will need to enter a series of 30 percentage values. Seemed like a great use for a grid, and while I was at it I thought I'd try implementing data bars using DataGridView's CellPainting event. Here's my code:
private void dataGridView1_CellPainting(object sender, DataGridViewCellPaintingEventArgs e) { DataGridView dgv = sender as DataGridView; if (dgv.DataSource == null) return; if (e.ColumnIndex == 1 && e.RowIndex >= 0) { if ((e.State & DataGridViewElementStates.Selected) != DataGridViewElementStates.Selected) { e.PaintBackground(e.CellBounds, true); Rectangle rect = e.CellBounds; rect.Offset(-1, 0); rect.Height--; rect.Width = (int)((float)e.Value * rect.Width / 100 + 1); if (rect.Width > 0) { using (LinearGradientBrush lgb = new LinearGradientBrush(rect, dataBarColor, Color.White, 0.0)) { rect.Offset(1, 0); rect.Width--; e.Graphics.FillRectangle(lgb, rect); } } e.PaintContent(e.CellBounds); e.Handled = true; } } } ... and here's a screenshot:
Comments
# Hairyman
21/03/2006 1:02 PM
that looks nice, will it work with anything else other than Excel 2007 or is what you have done independent of that ?
# mabster
21/03/2006 1:04 PM
It's nothing to do with Excel 2007, other than the fact that I copied the idea from them.
# crucible
21/03/2006 1:07 PM
hey mabs!
'grats on your appointment to the Office 12 dev team!